1. Cold winter
The year 2010 was a wild one in Alabama when it came to temperature extremes. The abpve chart shows the high (orange) and low (light blue) temperature as a dot for every day of the year, along with curves showing the normal high and low for each day. The early January cold outbreak shows up well, with several nights with lows in the teens and days with highs in the 20s. The cold was more persistent, though not as extreme, in February, with lows in the 20s most nights. Notice also the extreme cold in December…with 22 out of 31 nights at or below freezing, and 4 in the teens.
2. Hot summer
Tenperatures bounced around normal during the spring, but then we started having very hot temperatures over the Summer. Notice that the highs and lows were above normal almost every day in June, July, and August. We had highs of 95 or above on 39 days, and 100 or above on 10 days). What made this summer feel so hot was that, unlike 2007, we had humidity for most of the summer. That kept overnight lows above normal, too (mainly above 75 in July and August).
The idea here is that we had cold winters on each end of the year, with a hot summer in the middle. Here is a similar chart, showing daily mean temperatures.

On 81 of 91 days in June, July, and August, temperatures were above normal. On 67 of 91 days in January, February, and March, temperatures were below normal. As a matter of fact, Jan, Feb, and Mar, and Dec were all in the top 10 coldest in BHM since 1896, and Jun, Jul, and Aug were all in the top 10 hottest.
3. Importance – energy consumption
A good statistical way to measure daily temperature variability is the standard deviation, that tells you how far away (in degrees) from the yearly average temperature each day averaged out. The standard deviation in temperature at BHM in 2010 was 18.2 degrees, the largest on record. It is normally 15.1 degrees. However, a better and more applicable measure is the number of heating and cooling degree days.
Over 30% of all residential electricity consumption comes from heating and air conditioning (Dept. of Energy). Some years, we have mild winters and mild summers, and people use less energy to heat and cool their homes. When it is cold in the winter and hot in the summer, like this year, people use a lot more energy. An estimate of the amount used is given by heating and cooling degree days. Alabama Power uses a base of 65 degrees. If the daily average temperature is 75 (high 85, low 65), that’s 10 cooling degree days. If it is 55 (high 65, low 45), that’s 10 heating degree days. With the cold winter and hot summer, this year also had the most heating and cooling degree days of any year on record. Here is a chart going back to 1960.
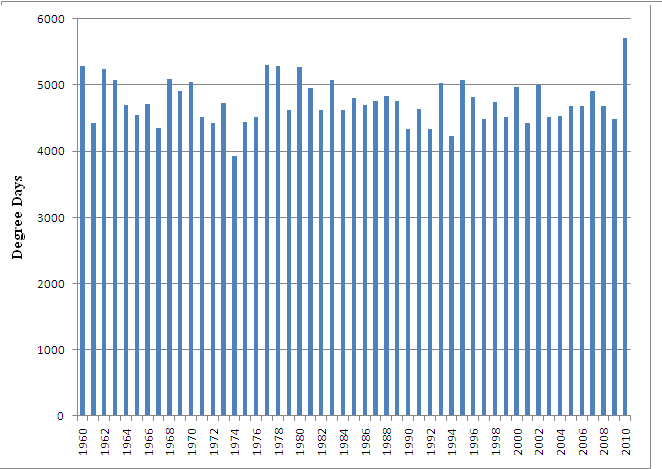
In 2010, there were 5705 degree days, about 21% above the normal 4704. This would imply electricity consumption (assuming 30% is HVAC) about 6% above normal.
How do we explain this? A chance occurrence, probably. It is possible that summertime low temps at the BHM airport ( 2 in the 80s) were biased upward a little by the urban heat island, but then why did the same not occur in the winter? Or did it, meaning the winter was even colder than shown? Many people have asked me if cold winters usually produce hot summers. Statistics since 1896 show little correlation between the winter and the following summer.
So far, this winter has been colder than normal again, and some of the coldest air is probably coming late next week.