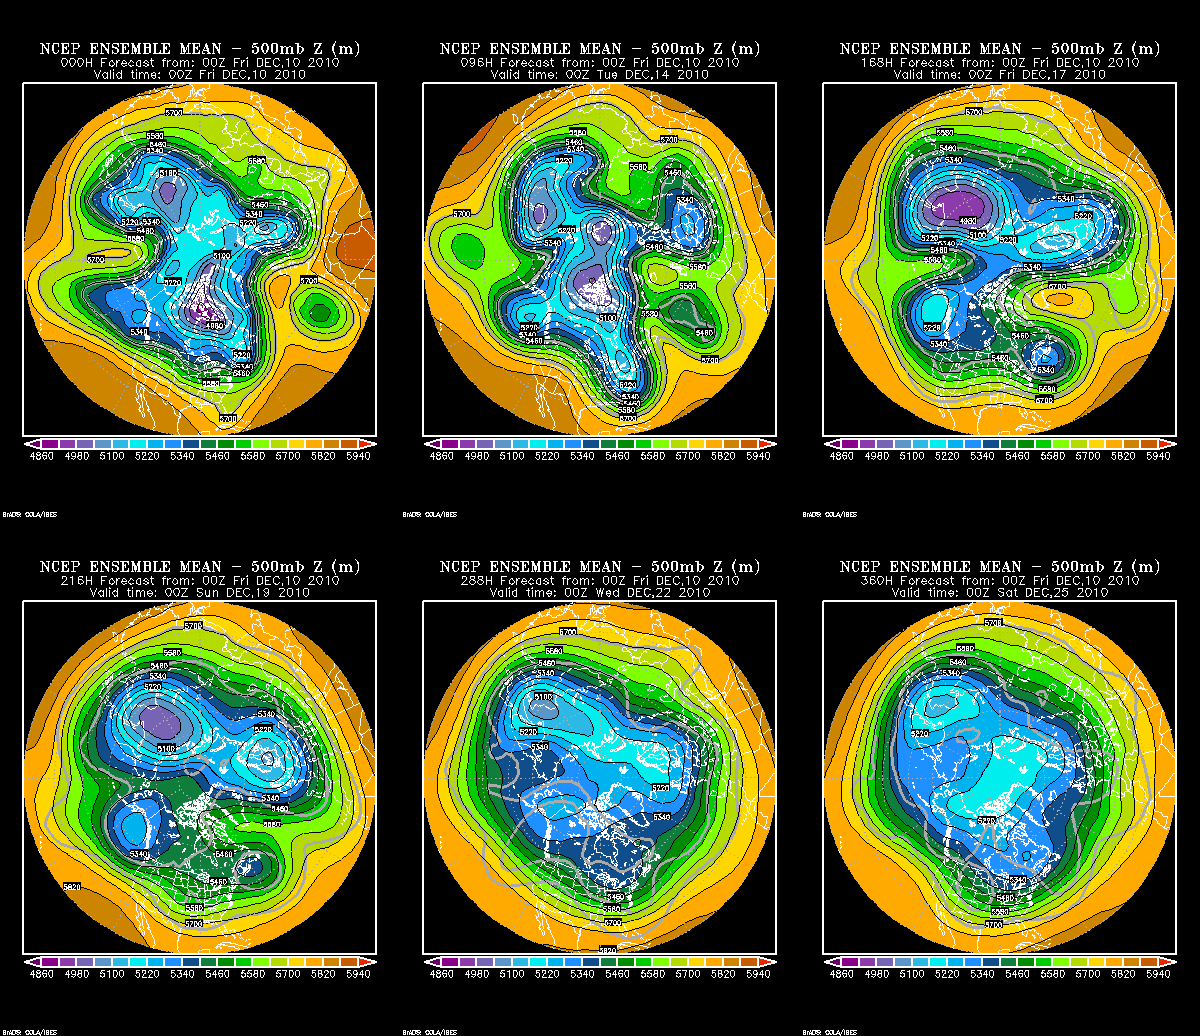
(GFS ensemble forecast 500 mb height charts for the northern Hemisphere, USA at bottom, Europe upside down at top, today through Christmas)
Since cold air is more dense than warm air, pressure changes faster as you go up in cold air, therefore the height of the 500 mb pressure field, also representing the flow at that level, is lower where it is colder and higher where it is warmer. Therefore, cold air is usually associated with an upper-level trough, and warm air with a ridge. Notice in the above 15-day loop, the big trough comes through here Sunday through Tuesday, when we expect the coldest air.
The spin of the earth must also be evened out, and these giant troughs and ridges, also known as Rossby waves, help to do that. Notice that, in the early parts of the above forecast period, there are several large waves moving around the northern Hemipshere. This represents an active pattern, with many areas of colder and warmer than normal temperatures, and storminess. Toward the end of the period, the waves damp out, indicating a return to more normal weather over the northern Hemisphere as a whole, with the coldest air concentrating at the pole again. The departure from normal of the 500 mb heights (a good analog for departure from normal on temperatures) is shown for the same map and time period below.
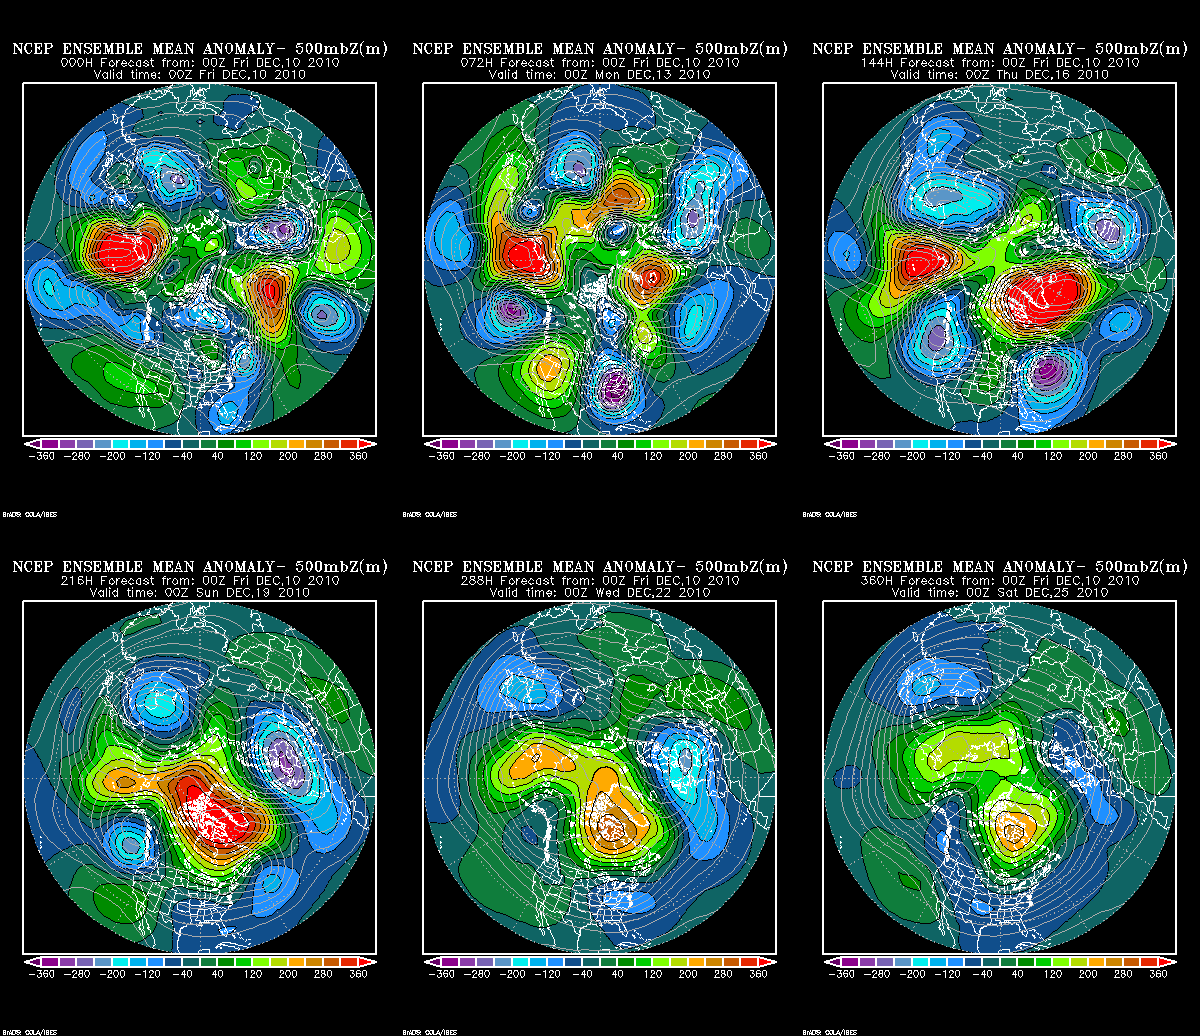
At the end of the period, when the waves damp out (if this model is right), 500 mb heights (and surface temperatures) should return to more normal levels in most places in the northern Hemisphere.
It is fascinating how the atmophere works as a giant engine, with many moving parts (air at different levels), thermostats (weather systems), etc.
Late addition: latest models are showing the possibility of rain moving in here with warm air aloft and cold air holding near the surface, causing the possibility of freezing rain, mainly from BHM NE, next Wednesday. Something to watch closely, but a lot can change between now and then.